Trend Analysis
Common-Size Statements
Using the figures provided, discuss the implications for the company. It must be a minimum of five sentences.


Ratios are based on the principle that patterns and trends emerge in business, which can be measured, interpreted, and used as guides for action
There are a huge number of ratios that can be calculated from a set of financial statements, but fortunately there are only a few that are really meaningful
One ratio ranks far above all others in significance. This is Profitability Ratio it included the return on investment (ROI) ratio
Profitabelity Ratio
Analysts may use various other acronyms when referring to this measure:
- Return on net assets
- Return on shareholders’ funds
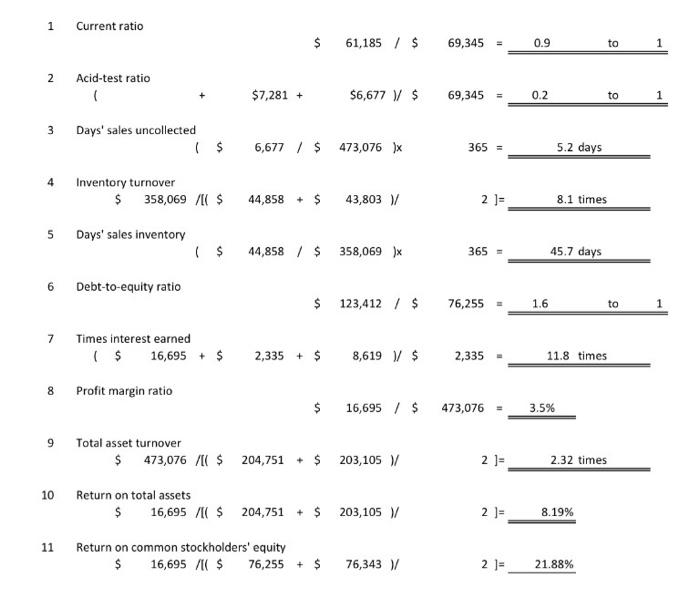
In the prasent case return on the total assets is 8.19 % while return on share holder equity is 21.88 % which shows good signal for company reputation.As 21.88 % Return on Common shareholder, then investor would like to invest in the compant because it is high
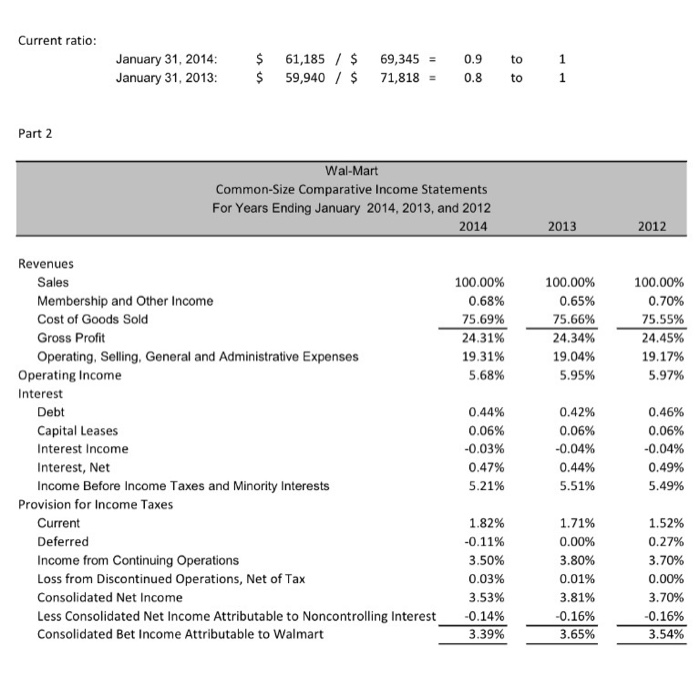
Gross profit margin = As we can see in the comparative financial statement that Gross profit margin is slightly declined in the yaer 2014 but on and average it remain on the same line
Operarting profit Margin & Net Profit Margin =As we can see in the comparative financial statement that Gross profit margin is slightly declined in the yaer 2014 but on and average it remain on the same line
Liquidity Ratio
Your business must be able to meet its short-term debts when they fall due.Two financial ratios, the Current Ratio and the Acid Test ratio.. The benchmarks were: a Current ratio of 2:1 and an Acid Test ratio of 1:1,
In the prasent case the ration are as follow
The current ratio is 0.9 to 1 in 2014 and 0.8 to 1 in 2013 and the Acid test ration is 0.2 to 1 so it is comparatively low to the standered so we can say that company,s liquidity position is lower
Solvency Ratio
Under the solvacy ratio we can see the debt to euity ratio is 1.6 to 1 which show that debt is high com-arative to the equty
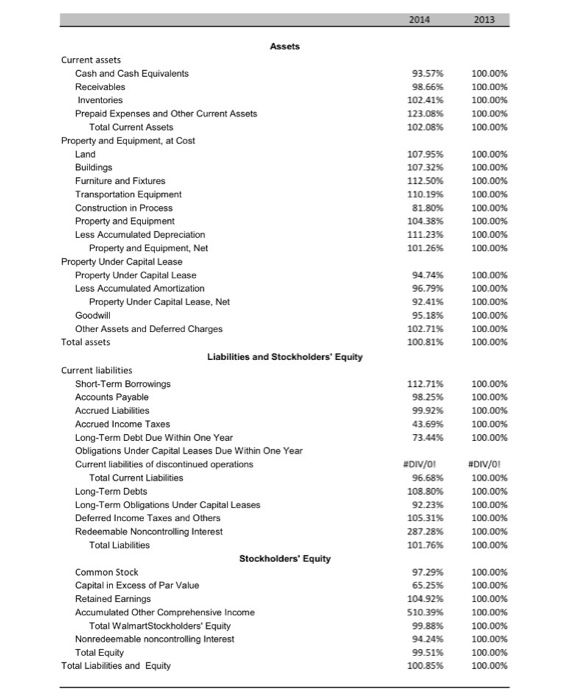
From the trend analysis we can make the comment that Profitabelity is slightly decline in the year 2014 then earlier year but liquidy is improved in the year 2014 then 2013
